Near…far

I’ve been spending time this summer developing a data visualization course for the iSchool’s new Data Science program. This course is intended to introduce graduate students in the program to concepts and skills related to the visual display of large sets f data. We’ll be covering three broad themes: 1) technical skills and tools, 2) graphic design principles, and 3) social and ethical issues related to visual representations of large data sets.

(If you are curious about data science in general, one of the faculty involved with the Data Science program, Jeff Stanton, just published a great (free!) eBook called “An Introduction to Data Science,” available through iTunes.)

In addition to Adobe Illustrator, it will be necessary for students to work with at least one of the open source programming environments that can handle large data sets and also have particularly powerful visualization capabilities (like R and Processing). We’ll be using R for the class, though Processing came in a close second.

Because it’s been a while since I have done any coding, most of the attention I have given to planning the course over the last several weeks has been devoted to getting reacquainted with the command line. I’m remembering how much a really do enjoy working with code (even if I’ll never be a rock star programmer and my heart has been won over by qualitative discourse analysis). But this post isn’t about programming.

Stating the obvious

When I sat down last week to map out what the class might look like on a week-by-week basis, I realized that I’d once again overlooked the obvious. My students will be predominately grad students with technical backgrounds and almost certainly will have had at least some exposure to coding. However, many will have never taken a visual design course. Ever. Clearly one of the most important objectives of the course is to provide a foundation and rationale for representing data in images and to create opportunities for students to learn the language of visual communication. If they don’t get exposed to these ideas here, they won’t get exposed to them anywhere.

So, as much as I was having fun with the code, I realized I needed to turn just as much attention to the basics of visual representation. I made a list of some basic visual design concepts that I thought might be most helpful in this context: proximity, similarity, contrast, scale. In thinking about it, however, I became highly self-conscious that my students might be insulted or maybe even disappointed by the sheer simplicity of these ideas.

Proximity

Take proximity for example: Near…Far. I could imagine my students saying, “Yeah, Jaime, we get it, it’s not that hard. Actually we got it a few years ago when we saw that Sesame Street episode…(am I really paying for this class????).”


The challenge of drawing attention to many of the most basic and core visual concepts is that we use these principles so constantly, continually, and intuitively that they are embedded in both physical and cognitive mechanisms for perception. The visual design principle related to proximity goes something like this: Things that are physically close to each other are related. Things that are distant from one another are not related. Beyond the notions of far and near, the power of this idea comes from the grey area between these two statements. No offense, Grover, but you are just tackling the tip of the iceberg.

It can feel a bit like stating the obvious when trying to talk to a student, or any one for that matter, who is technically minded and who may never have been exposed to design thinking or art making (visual, literary, music, any medium…). In fact, it can feel like shouting the obvious. There have been times in my classroom when I feel like Grover, breathlessly repeating the same mantra, hoping for it to click: “Near… far… near… far…near…far… DO YOU SEE WHAT I MEAN? DO YOU REALLY UNDERSTAND? SHOULD I DO IT AGAIN? HERE, LET ME DO IT AGAIN…”

The urgency that I feel at these times is not about whether my students understand the difference between something that is physically close and something that exists at a distance. I certainly hope they get that, they are college students for goodness sake. What  I am really trying to explain is that the intellectual and perceptual play embodied by visual design is theirs for the taking. I am hoping that they can make the connection that, as designers of information, concepts like near and far can be powerful tools of agency. Maybe I need to switch from channeling Grover to being more like Yoda.

Dante to Data Science

For me, effective visual communication involves embracing and exploring the space between opposites, dwelling within the grey area between near and far, heavy and light, black and white. There is a wonderful short book of essays by Italo Calvino called “Six Memos for the Next Millenium.” It is a collection of meditations on six literary themes: lightness, quickness, exactitude, visibility and multiplicity. The first essay explores the contrast between lightness and weight, using passages from Dante’s Inferno to explore the range that lightness can take, for example these two contrasting descriptions: “As snow falls in the mountains without wind” and “Like some heavy thing in deep water.” (p. 15)

When I try to think about ways to present basic visual concepts like proximity, I am overwhelmed.

Proximity makes me think of the contemporary postmodernist painting I cut my artistic teeth on: juxtaposition and dissonance were the first words I learned in art school (haven’t thought about David Salle in a long time….). By creating visual non sequiturs, these painting challenge our assumptions about the meaning of proximity in terms of cultural, social and psychological norms. Sometimes things that are in close proximity are not alike, no matter how much we try to make them relate to each other. Images that are close can be antagonistic, held in a delicate tension.
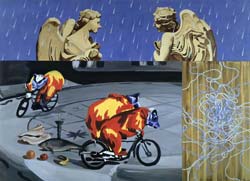
Angels in the rain by David Salle, Downloaded on 20 July 2012 from http://www.saatchi-gallery.co.uk/artists/david_salle.htm/

Proximity also makes me think of the physiology of the human eye and our cognitive ability to perceive and disambiguate occluded forms. The image below is from a book by Donald Hoffman, a professor of Cognitive Science at UC Irvine, called “Visual Intelligence.” Among other things, this book highlights the cognitive leaps we make about the relationship between shapes when information is missing or incomplete.

Adapted from “Visual Intelligence: How we create what we see” by Donald D. Hoffman. W.W. Norton & Company, 1998.

And proximity makes me think of the stars in the sky, how the points of light that I perceive as being near to each other, might actually be light years apart. In fact, depending on how far away they are from where I stand, and the length of time it has taken for the light to get to me here on earth, those two stars that I plainly see as being side by side might not even have ever existed at the same time.
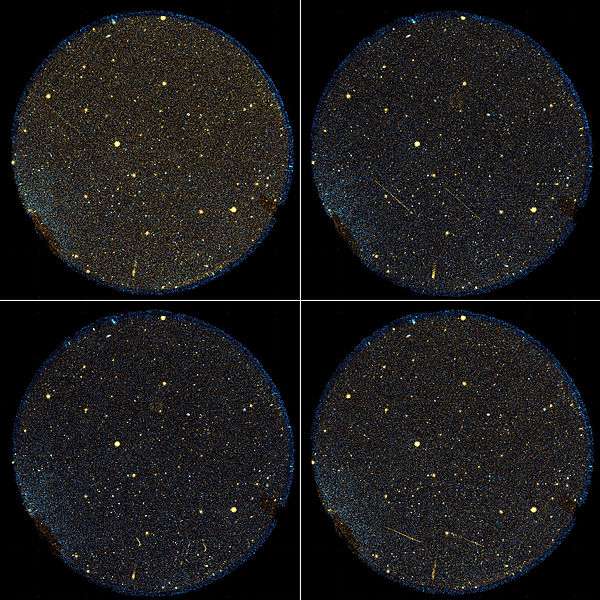
Photo Credit: NASA/JPL-Caltech. The two brightest objects appear to perform a sharp turn then travel in the reverse direction. This illusion is most likely the result of the Galaxy Evolution Explorer overtaking the objects as it orbits around Earth. Downloaded on 20 July 2012 from http://commons.wikimedia.org.


And here we come back to data science. When we represent large sets of data using images, the goal is to reduce the data to only that which is useful, to identify patterns, to find the needle in the haystack. Similar data points might be literally or figuratively very far away from each other. False relationships might appear as a result of coincidentally close proximity.

My task is to talk to my students about things like near and far in ways that will show the power behind the principles so that these future data scientists can go into the rapidly expanding universe of data fully equipped to describe what they see. They will probably not express themselves as poetically as Dante, but I hope to cultivate in these technical students an appreciation and high degree of sensitivity to the grey area between near and far, big and little, identical and unique.

 

Posted in Field report | Leave a comment

Out of sight

Yes, it’s been a long time since I posted, but I have a good excuse. I recently completed and defended my dissertation. So I have been writing about the visual forest, just not in blog format.  Quite the opposite. But now that the final document has been reviewed, revised and accepted (submitted on Leap Day), I hope to be contributing posts more regularly. More pictures, more frequently.

For those that are curious, I received my PhD in Information Science and Technology from the School of Information Studies at Syracuse University. My dissertation is entitled “Image-Enabled Discourse: Investigating the Creation of Visual Information as Communicative Practice.” The abstract is below and pdf of the full, final version is here.

ABSTRACT. Anyone who has clarified a thought or prompted a response during a conversation by drawing a picture has exploited the potential of image making as an interactive tool for conveying information. Images are increasingly ubiquitous in daily communication, in large part due to advances in visually enabled information and communication technologies (ICT), such as information visualization applications, image retrieval systems and visually enabled collaborative work tools. Human abilities to use images to communicate are however far more sophisticated and nuanced than these technologies currently support. In order to learn more about the practice of image making as a specialized form of information and communication behavior, this study examined face-to-face conversations involving the creation of ad hoc visualizations (i.e., “napkin drawings”). A model of image-enabled discourse is introduced, which positions image making as a specialized form of communicative practice. Multimodal analysis of video-recorded conversations focused on identifying image-enabled communicative activities in terms of interactional sociolinguistic concepts of conversational involvement and coordination, specifically framing, footing and stance. The study shows that when drawing occurs in the context of an ongoing dialogue, the activity of visual representation performs key communicative tasks. Visualization is a form of social interaction that contributes to the maintenance of conversational involvement in ways that are not often evident in the image artifact.  For example, drawing enables us to coordinate with each other, to introduce alternative perspectives into a conversation and even to temporarily suspend the primary thread of a discussion in order to explore a tangential thought. The study compares attributes of the image artifact with those of the activity of image making, described as a series of contrasting affordances. Visual information in complex systems is generally represented and managed based on the affordances of the artifact, neglecting to account for all that is communicated through the situated action of creating. These finding have heuristic and best-practice implications for a range of areas related to the design and evaluation of virtual collaboration environments, visual information extraction and retrieval systems, and data visualization tools.

Posted in Uncategorized | Leave a comment

“Let’s listen with our eyes not just our ears.”

My favorite definition of information comes from Gregory Bateson in his book Steps to an Ecology of Mind (1972). He wrote that information is “difference that makes a difference.” I find this statement very compelling. I like to play with it, looking around at my physical environment and training my eye on the most subtle differences I can see. It also makes me think about twilight when everything sort of does that flip flop where dark things become light and light things become dark. The mechanisms we have to discern differences are not stable, by any means. Which means that information is far from static.

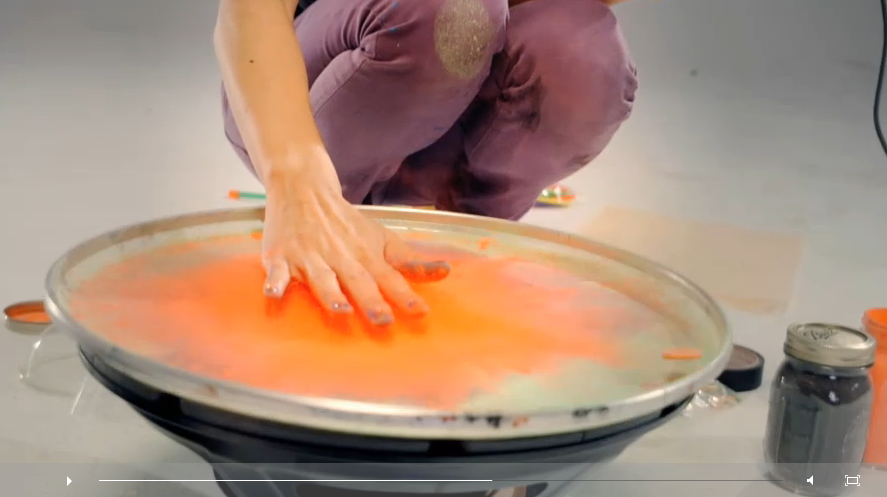
Bateson’s definition of information was the first thing I thought of when I viewed this video: Todd Selby x Christine Sun Kim: The Selby Profiles Deaf Performance Artist Sun Kim’s Sonic Experiment. The title of this post comes from one of the fleeting subtitles in this short film.  Thanks to Josh Kitlas for sharing it with me.

Still from "Todd Selby x Christine Sun Kim"


Posted in Uncategorized | Leave a comment

I’m glad we don’t have a TV.

This post is kind of an addendum to the previous post. The issue of difficult images came up again recently.

Early this week, Curtis came on from work and said, “Have you seen the news?” Colonel Muammar el-Qaddafi had been killed earlier in the day by Libyan forces. I had been watching the headlines online all day, so I had heard about the attack and was aware that there was some uncertainty about whether he was actually dead.

Curtis works for a company that does home renovations, so he spends his days going in and out of people’s houses. His last client of the day had been watching the news and so Curtis had caught glimpses of footage from events in Libya as he was finishing up his work.

At this point, I need to interject something. We don’t have a TV in our house and we don’t have a cable subscription. I don’t want to misrepresent anything. I watch television. Regularly. I watch on the internet and on iTunes.  This means that I’m not really up on the latest commercials and I generally never watch the news, local or otherwise, (unless you count The Daily Show). Even with high quality photos and videos included with many stories reported on online, most of the time when I am checking the news I’m scanning headlines and skimming  articles.

When Curtis walked in the door and asked me if I had seen the news, he literally meant “Have you seen the photos and videos of the death of el-Qaddafi being shown on TV?” As he described the images that had been played and replayed all afternoon, I was honestly stunned. I know that at this point, I should not be shocked by things like this. But I am. I had assumed that the confusion about when and how el-Qaddafi was killed stemmed from the usual attempts to confirm information from reliable sources. I had no idea that the situation was actually compounded by gruesome, graphic images popping up online that left significant doubt about whether the obviously seriously wounded human in the shot was dead or alive. I don’t know exactly what bothered me most: the thought of these images being played in an endless loop all day long, my own unease about celebrating the murder of a human being, or the futility of trying to articulate why we need to handle images like these with far more care than commonly seems to be used by mass media.

These issues also came up when the death of Osama Bin Laden was announced. I’m on a few listservs devoted to visual research and methods. The absence of photos “proving” Bin Laden’s death was a hot topic in May of this year. A recurring theme on these discussion boards was the notion that, even in the age of readily available photo editing tools like PhotoShop, there was a wide spread outcry for photo documentation of Bin Laden’s corpse, apparently accepting digital images as reliable proof. I guess seeing is still equated with believing, even when we regularly see the magic of computer generated images (CGI) on television and in the movie theatre.

Alleged photos of a dead Bin Laden were exposed to be a hoax [PLEASE NOTE: This link contains potentially disturbing images], the result of merging an image of a brutally beaten man with a old photo of Bin Laden. The general public received a lesson in digital image manipulation, but this just exposed the mechanics of visual deception. I don’t think this blip in the news cycle did much to help us think more deeply about how we depict death and violence, and what basic dignities are owed to human beings.

I’ve been thinking a lot about focusing some of my future research on the topic of  the credibility of visual information. Unpacking the tangle of philosophical, ethical, social and technological issues this latest encounter reflects will take some time. I just know that this week, I was really glad that we don’t have a TV.

Posted in Field report, Visual journal | 1 Comment

Visualizing anguish

In the beginning of July, I traveled to Vancouver, BC to attend this year’s International Visual Sociology Association (IVSA) conference. Many of the presenters and attendees are trained in and practice sociology, the conference is also attended by public health workers, psychologists, art historians, photographers and artists, among others. The common thread through all of the work presented was the use of visual methodologies in social science research. It was a rich and diverse three days, but it was the last session I attended on the very last day of the conference that still has me thinking.

The panel was entitled Dilemmas Involved in Visually Representing War and Trauma. Two of the four presentations in the session focused on the psychological and ethical environment created by the action of visually documenting another human’s suffering. The work presented by the two researchers revealed the complex ethical and moral dilemmas inherent when one is confronted with a scene of anguish and the decision to take a picture is made over any other possible action.

"Mine is a world of incomprehensible shadows". Severely retarded mentally and physically, she never spoke, was stunted and probably never walked. She was one of a quarter of the world’s children at risk of iodine deficiency, known to be the world’s leading cause of preventable mental retardation.CREDIT: I, Tyabji. Downloaded on 16 Aug 2011 from http://commons.wikimedia.org/wiki/File:Cretin_Child_(1).jpg

Debra Pentecost, a sociologist from the University of British Columbia, presented a talk called Times of war and conflict: Exposure to traumatic events.  She discussed the ethics of representation inherent in the task of documenting war, pain, and violence. She quoted passages from interviews she conducted with photojournalists, sharing comments some made about the impotence they feel when the only comfort they can offer their subjects is that the “image will appear on the news.” Pentecost explained that some of the photographers told her they thought this meant nothing to subjects in the photos, victims of the violence being documented. She talked about the perceived value of difficult images, both as historical evidence and media fodder. (There was an unintentionally dramatic moment occurred when the drumming and chanting of a religious ritual being demonstrated in a presentation next door interrupted Pentecost as she was speaking about censorship of images of war.) She asked us all to think about how we internalize and process these images and how the increasing frequency of video documentation might be influencing our feelings about documenting scenes of disaster and trauma.

Patrice Keats, a clinical psychologist from Simon Fraser University, presented on The visual work of photojournalists: Disasters, social justice violations, and war. Keats interviewed 40 photojournalists who had covered natural disaster, war, and trauma. Through her research, she asked: What is actually happening from a psychological perspective when photojournalists are taking photos of disaster, violence and trauma? What enables these professionals to put the task of visual documentation before all else?  She shared excerpts from her interviews, revealing the ways in which photojournalists described the camera acting as mediator, buffer, armor and shield between themselves and the horrific scenes they documented. She contrasted this to the role of the naked eye in witnessing and making connections with fellow humans who are suffering.

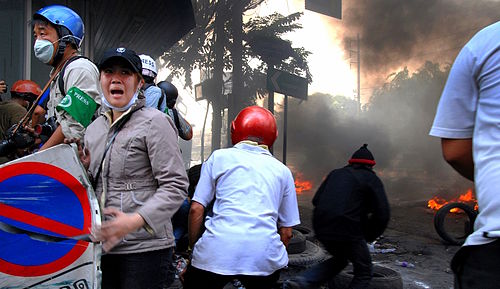
Anti-government protest in Bangkok, May 15, 2010. A woman cries as there are still wounded men lying out on Rama 4. The army continues to shoot at the location where they are lying even after people, including Thai journalists and rescue workers, have asked them to stop. One hardcore "red shirt" boy runs out to aid the wounded.. By Takeaway. Downloaded on 16 Aug 2011 from http://commons.wikimedia.org/wiki/File:2010_0515_rama_4_and_sathorn_36a.JPG

Both researchers were essentially asking the same questions: What does it mean for someone to observe pain and anguish, and react by pushing a shutter release to create a visual representation of the suffering?  What are the social, cultural and personal implications of this action? How does society see both the photographer and the product of his or her action?

Neither presentation offered anything close to definitive answers, but the open discussion that followed revealed the deep chord that this work had struck with the room full of visual researchers.

One of the themes of that conversation was the inherent value of capturing images of difficult scenes. While there was not consensus among the entire audience, most people seemed to agree that there was cultural and social value in documenting the human experience of suffering. Of interest was the complex social role played by those both willing and able to document such difficult experiences, and the negative, or at the very least conflicting, perceptions society sometimes had about such people. In this context, a classic article was mentioned: “Good people and dirty work,” written by EC Hughes in 1962. Hughes was an early contributor to the study of Nazi Germany.

At some point, one of the audience members brought up the issue of citizen journalism. By this point, we have all probably read, if not actually contributed to, some form of citizen journalism, in the form of “eye witness reports” aggregated by the 24hour news programs.  Social media has changed the role of the citizen journalist, and the group wondered how the task of documenting such events may be changing as a result. Live blogging, tweeting and video uploads are all venues for the lay person to contribute to the journalistic record. In this sense, now we all have the means to be photojournalists, from production to dissemination.

But does the citizen photojournalist have the same mandates, the same ethical principles as the professional? Does the person holding the camera phone when disaster strikes feel the same responsibilities toward documenting the breadth of the human experience as the trained photojournalist? Is the camera lens of the professional somehow different or more legitimate than the camera phone of the citizen when it comes to authority to document suffering?

If your house were burning down, and your neighbor stopped to take a photo before helping you, how would you react? Would you feel differently if a professional photojournalist did the same thing? Would you feel differently if that photo your neighbor took was eventually published on the front page of The New York Times? How about if you saw it on Facebook?

Yes, this session still has me thinking, maybe because, for me, it generated far more questions than it answered.

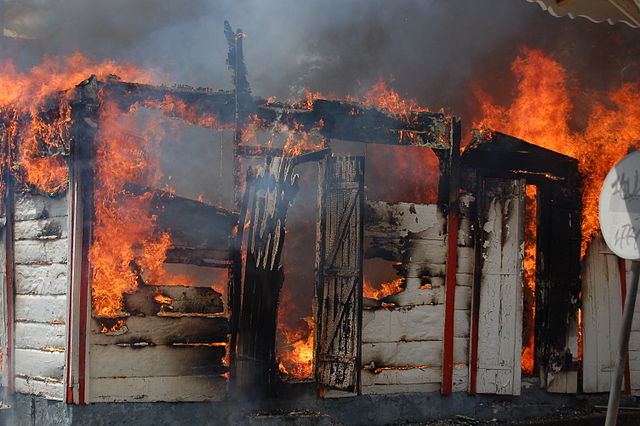
Burning House in Le Moule, Guadeloupe, August 2009. By KoS. Downloaded on 16 Aug 2011 from http://commons.wikimedia.org/wiki/File:Maison_en_feu_Moule.JPG


Posted in Field report | 2 Comments

Hidden in plain sight

Visual literacy, in its most general sense, refers to the skills needed to interpret and use graphical information resources. It means knowing how to read a map. Or having enough sensitivity to social and cultural stereotypes to know when an image in a magazine is exploitative or sexist.

Visual literacy is often discussed in the context of education (for example). How can we incorporate visual skills into information literacy lessons? How can we teach our students to assign appropriate attributes and citations to the images they download off the web? We also talk about visual literacy in terms of the massive amounts of multimedia resources to which we are exposed through the web and the entertainment industry: How do we become more responsible consumers? How can we tell when an image, or film or music video is harmful or discriminatory?

These are important questions and I will write more about them later.  But this morning, I’m thinking about another kind of visual literacy.  I’m thinking about not just having the ability to know how to look at an image, but also having the perspective to understand  where to look.

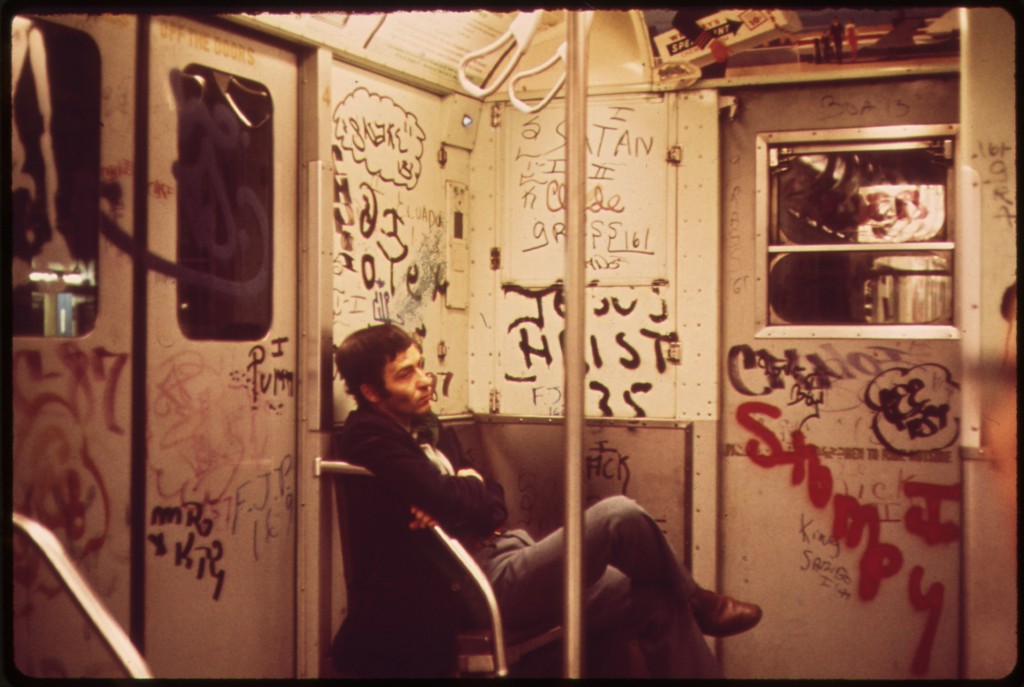
A few years ago, I heard graffiti artist and painter Tim Clorius (aka Subone) speak at a conference. His presentation documented the historical evolution of tagging and graffiti. The narrative that Clorius brought to this history was guided by his own evolution as an artist and the work he has done building a public art practice in collaboration with at-risk youth in the Portland, Maine area.

Clorius described the ways in which, throughout industrialized times, marginalized, itinerant social groups have communicated with each by leaving messages in highly visible, public locations. He talked about markings made on the sides of box cars that were used by hobos to communicate with each other as they moved back and forth across the country in the early part of the 20th century; and he followed all the way through to current debates and practices associated with what we now know as graffiti art. (Most of us have probably heard about the special police task forces in charge of deciphering tags as a means for keeping tabs on gang activity.)

Subway car, 1973. Downloaded on June 27, 2011 from http://commons.wikimedia.org/

Clorius is not the only one to have compiled such a history, but perhaps because of the way he told the story, what he was saying really struck a chord in me at the time and has stayed with me since. He made a strong connection between a sense of identity and the act of leaving a physical mark on one’s environment. He talked about tagging in a way that evoked the idea of voice, stance and territory. As he decoded various examples of more recent graffiti art, he revealed the mechanisms of empowerment that he saw at play.

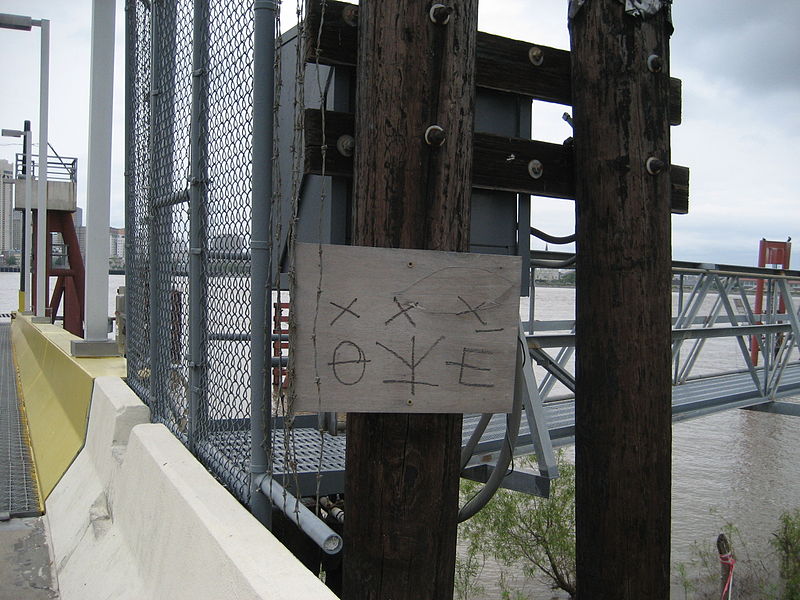
Hiding messages in the open is a true feat of visual literacy, requiring a nuanced understanding of the craft of visual communication. The goal is to make the sign undeniable to those “in the know,” while having it remain invisible to everyone else. It’s an interesting information design problem. And it’s an interesting visual design problem.

Hobo or tramp markings at Algiers entrance to Canal Street Ferry across Mississippi River, New Orleans.Downloaded on June 27 2011 from http://commons.wikimedia.org/wiki/File:HoboMarkingsCanalStFerry.jpg

Hiding messages in plain sight, especially when done by an underground movement or marginalized group, is bold. It puts a lot of faith that the “other” (whomever that may be) has a  collective obliviousness to their visual environments. In fact, these subversive communication systems actually depend on the selective attention and tunnel vision that we so often profess to be fighting against. I know that I am constantly trying to get my students to open their eyes, to look around, to report what they see.

These cryptic visual systems rely on an ability to slip through the cracks, to remain left of center, to be on the margins of our field of vision. In these terms, accessibility and universal literacy are not helpful. These signs and symbols get their power in part from our blind spots, having communicative value to those who use them by the very fact that they seem like nothing to the rest of us.

For a while I was reading a lot about Roma (Gypsy) culture and I found a number of examples of this kind of visual literacy throughout their stories of nomadic movement, secrecy and marginalized living. There’s an interesting tale of complicity between the World War II Resistance Movement and the Roma community of Western Europe in the book Crossing: A Journal of Survival and Resistance in World War II by Jan Yoors. The loose-knit partnership, as described by Yoors, centered on the off-the-grid system of communication used by the Roma in order to stay in touch inspite of being in constant motion.

A sign from the French hobo or gypsy sign system, meaning here live kind-hearted women. Downloaded on 27 June 2011 from http://www.symbols.com/encyclopedia/22/2222.html

The system made use of symbols carved into fence posts or hung at crossroads, virtually invisible to those outside the group, but unmistakable to those within. According to Yoors, the Roma shared this system with the partisans and it proved to be vitally important to the Nazi resistance.

True or not, this story illustrates the kind of visual skills that I’ve been thinking about. It reflects a kind of visual literacy that embodies issues of identity, expertise, and creativity, and that is divorced from record-keeping, documentation, and institutionalization. These are living systems, that expand and contract, that respond to the environment, circumstances and situations in which they are deployed. Once they are understood by a larger audience, they cease to function and must change in order to remain useful.

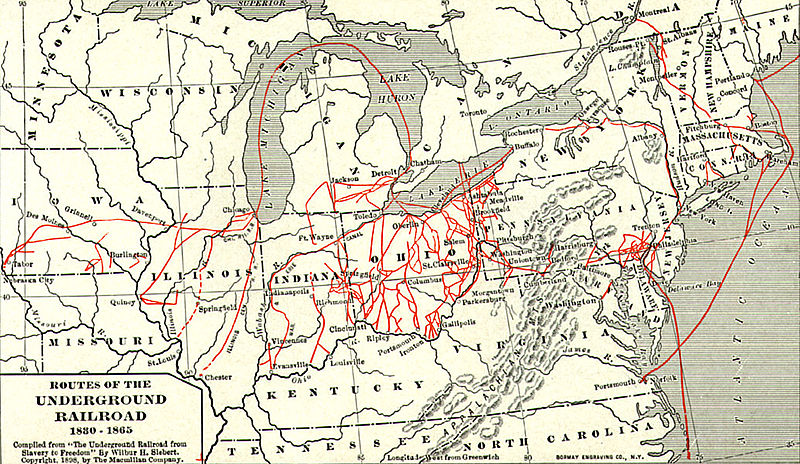
I think this is one of the reasons I’m also intrigued with the idea of the Underground Railroad.  I mean, in addition to the role it played in African-American history, the abolition of slavery, and the development of race relations in this country. I’m really curious about how it actually worked.  How would you know who to trust? How would you know where to go?  You’re scared, tired, hungry. Chances are high you can’t read.

From what I have come across, the evidence for how it really worked is scarce: there are stories about using patterns in quilts to show the way (but these ideas have been refuted); there are accounts describing signals in the form of lanterns, statues, laundry on the clothes line. But there’s just not a whole lot of corroborating documentation, as the whole process was secretive and dynamic by necessity, and visual and largely non-verbal by nature. (Although it is interesting to read about the clues left in song lyrics…)

Downloaded on 27 June 2011 from http://commons.wikimedia.org/wiki/File:Undergroundrailroadsmall2.jpg

The problem that motivates all of these situations is clear: off-the-grid communication is needed; other forms of literacy can not be relied upon, and the  signals being sent need to be undeniably visible to some, while remaining utterly invisible to others. In all of these cases a form of visual literacy evolved that was built on the principle of hiding the message in plain sight. Visual secrets unlocked according to who’s doing the looking and if they know where to focus their attention.

Sure does make me wonder about all the things I’m missing when I walk down the street….

Posted in Visual journal | 4 Comments

I am not a (graphic) designer.

I just finished my first semester teaching a brand new graduate-level course that I created called Information Design. The School of Information Studies at Syracuse University generously allowed me try out this new offering and I was delighted to get a full class the first time out of the gate.  Based on a show of hands on the first day of class, most of the students expected the course to focus on graphic design and visualizing information. But information design means something more than that to me and I tried to make this class reflect that. Fortunately I didn’t scare away too many students on that first day.


In fact, I’ve found that most people assume that when you start talking about design, you mean visual design. I run into this a lot, especially since my area of academic research is visual information and the majority of my formal education is in visual art. It is easy to see why I often get mistaken for a graphic designer. When it happens, I usually say something like, “Oh, no, I’m not a designer, I’m actually trained as a painter…” People outside of the art & design community generally respond with something like “Oh, whatever, it’s all the same, your one of those visual/art-y/bohemian people, right?” For people inside the art & design community, my statement is met with a knowing smile accompanied by a decided drop in my credibility. Painters are not designers (and generally can’t design their way out of a paper bag).  Everyone knows that.

So whenever I talk about designing with information, I try to be very upfront about the fact that I do not consider myself a graphic designer.

In reality, my formal training in this area is limited to the obligatory design courses that were taught as part of my undergraduate foundations program at art school.  At the time, I wasn’t particularly interested in these graphic design classes, strongly preferring the visceral experience of working in the painting studio.  Fortunately, I got a chance to  supplemented this neglected part of my education during the several years I worked for various design firms an interactive producer and information architect.  My web development teams always included at least one visual designer and this exposed me to some  highly skilled and articulate typographers, graphic designers and creative directors. While one of my primary jobs was to organize the information to be presented through a website (designing the information architecture), the visual designers focused on crafting the graphical user interface (GUI) through which the information would be accessed.

It was while collaborating with these folks  that I really came to understand how little I knew about graphic design. It actually came as a little bit of a surprise to me. I mean, really! I’ve been a practicing visual artist for years! I spent many years studying painting! I know color.  I know shape. I know balance, composition, rhythm. I can draw! But what I learned by watching gifted graphic designers work is that while we shared a similar visual language, my accent was all wrong. My eyes were not trained to the same calibration as theirs.

During the time I worked in industry, on occasion, when  the schedule was very tight, I would be the one tasked with making an initial mock-up of an interface design, or with making edits to an existing file, just to keep the ball rolling.  Then I’d take the file to the real designer who would thankfully fix it: adjusting the colors by barely imperceptible degrees; shifting a block of text 10 pixels to the left; moving a photo up by a 8 pixels; taking away a border here; increasing the space between two letters in the header by a couple of pixels. The impact of several relatively small  changes was huge and undeniable (and actually kind of magical sometimes). The transformation was evidence of their craftsmanship.

Slowly, I got a little bit better at seeing like a designer, but I was never able to achieve the fluency that comes from many years of training and practice.  This is why I do not call myself a graphic designer. (…And given a choice, I’d still take stinky, old school oil paints over Adobe Illustrator any day of the week.)

However, I have and do design with information. It’s just not always visual information.

Probably because I have been so focused on the kind of designer that I am not, this is actually a relatively recent revelation for me, and I am still a bit tentative about saying it out loud.  After spending years fighting the label of designer (for precisely the reasons described above), not long ago I realized it might be possible to be an experienced information designer without being a gifted graphic designer… And that there is a lot to be gained from separating the two practices: graphic design and information design.

Getting back to my Information Design course, when I began to plan the class, I wanted to explore this idea. For that reason, we actually only spent about a third of the semester talking about specifically visual concepts and principles.  What did we do the rest of the time? Well, here’s the syllabus, you can see for yourself. The students learned how to think about information separate from computers and technology, to recognize real, living information and information systems in their environment (we referred to it as “in the wild”) , to identify all the components of those systems, and then to take an action that would somehow influence or change that the flow of information through that system.

It was a great semester and I think I learned as much or more than the students did.  I’m looking forward to teaching it again next spring.


Posted in Visual journal | 1 Comment

A single continuous line of ink

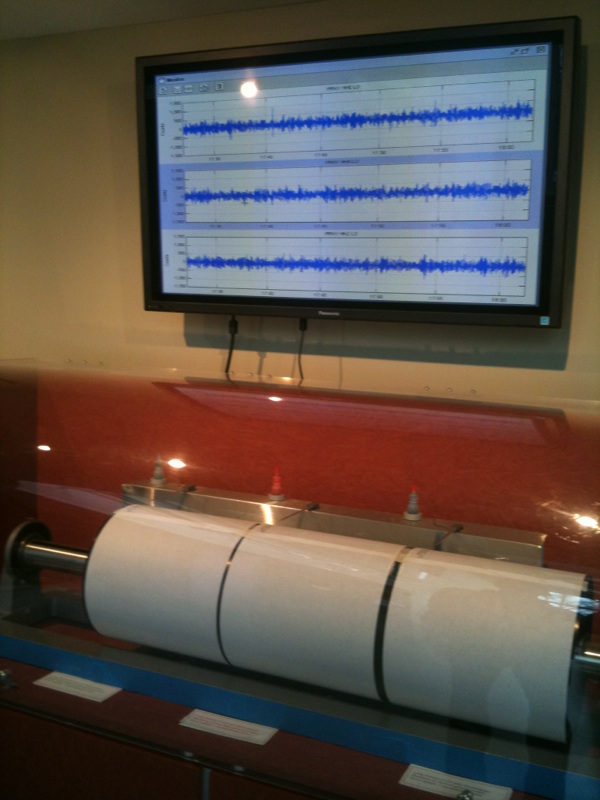
Last weekend we took a trip to Ithaca’s Museum of the Earth.  Just past the exhibit about corn (oddly fascinating), was a seismograph machine.  This complex device is used to recognize and measure global seismic activity, documenting and recording movement within the earth’s tectonic plates using an essentially simple graphic interface.

Although today data is captured in digital form, seismographs have also traditionally generated ink drawings that can be analyzed after a seismic event to determine the direction, duration and intensity of tectonic activity.  To create this visual record, a piece of paper is wrapped around a drum. A very small and delicate pen rests very lightly on the surface of the paper. The cylinder rotates at a very slow rate of speed (see video below). When a tremor occurs, the pen tip records the duration and severity of the movement by leaving a jagged trail on the paper.

The seismograph machine at the Museum of the Earth in Ithaca, NY.

As it trails around the drum, the pen also slowly moves down the length of the cylinder, preventing the tip from writing over previous data. By the time the barrel has made one complete rotation (1 hour for the machine in this video), the pen tip has moved down the barrel by about an inch from its original position. The result is a long line of ink that spirals around the cylinder and down the page, recording any seismic activity that is registered by the equipment.

When I was a little kid, I used a similar technique to record the movement of the family car as we drove around town running errands or on longer road trips. I would  let a pen or pencil rest just on the surface of the page, exerting as little pressure as possible, while maintaining contact between the tip and the paper.  As we drove over bumps and around corners, the tip moved across the surface of the page, creating a cryptic record of our journey.

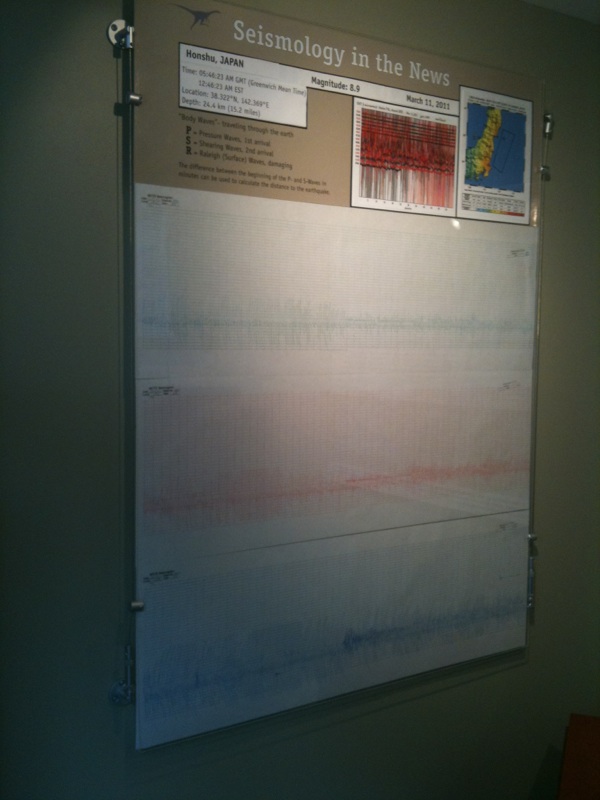
Two members of the museum staff were performing some routine maintenance on the equipment when we arrived, including changing the paper wrapped around the barrels and making sure that the ink reservoirs were filled.  Displayed on the wall beside the machine were three graphs showing different dimensions of the movement of the earth during the tragic 9.0 earthquake that had occurred just off the coast of Japan.

Seismograms from March 11, 2011. The massive change in amplitude reflects the major earthquake that was centered off the north eastern coast of Japan.

The earthquake and resulting tsunamis had occurred just a day before our visit so the impact of the catastrophe was still  unfolding as we stood listening to one of the museum staff explaining the images that we were examining.  As we learned more about how to read the visual records, how to connect specific points on the continuous line with events from the news over the last day or so, the reality of what we were looking at sunk in.

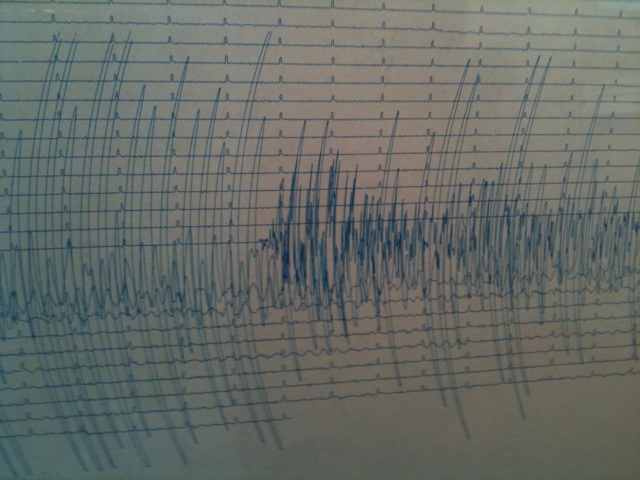
Detail of a seismogram created during the Honshu earthquake on March 11, 2011.

The museum display discussed the jagged line of the seismogram as a seemingly simple and straightforward record of change over time. However, as I registered exactly what I was looking at, my interpretation of that single continuous line became inextricably entwined with the memory of violent and terrifying images circulating on line since the quake.  The coupling of radically different graphic representations of the same event created an image of undeniably brutal change.  During the period of time when the earth’s crust was most highly agitated, the lines are dark, abrupt, thrusting up and down, aggressively pushing the limits of the recording device.

Museum staff explained that during this period of intense seismic activity, the island of Honshu had actually shifted eight feet to the east. At that moment standing there in the Museum of the Earth, following that single continuous line as it jumped, jutted and lunged across the page, I thought I was looking at what happens on earth when a change of that magnitude happens.

Over the next several days, the crisis in Japan continued to deepen. Nuclear power plants failed, the number of casualties soared, and a shortage of water, food and shelter reached critical points. Even more photos and videos poured on to the internet.  I thought a lot about the violent change reflected in that single continuous line. And my perception of what it means to see change of such devastating magnitude changed.


Posted in Visual journal | Leave a comment

What I see today…

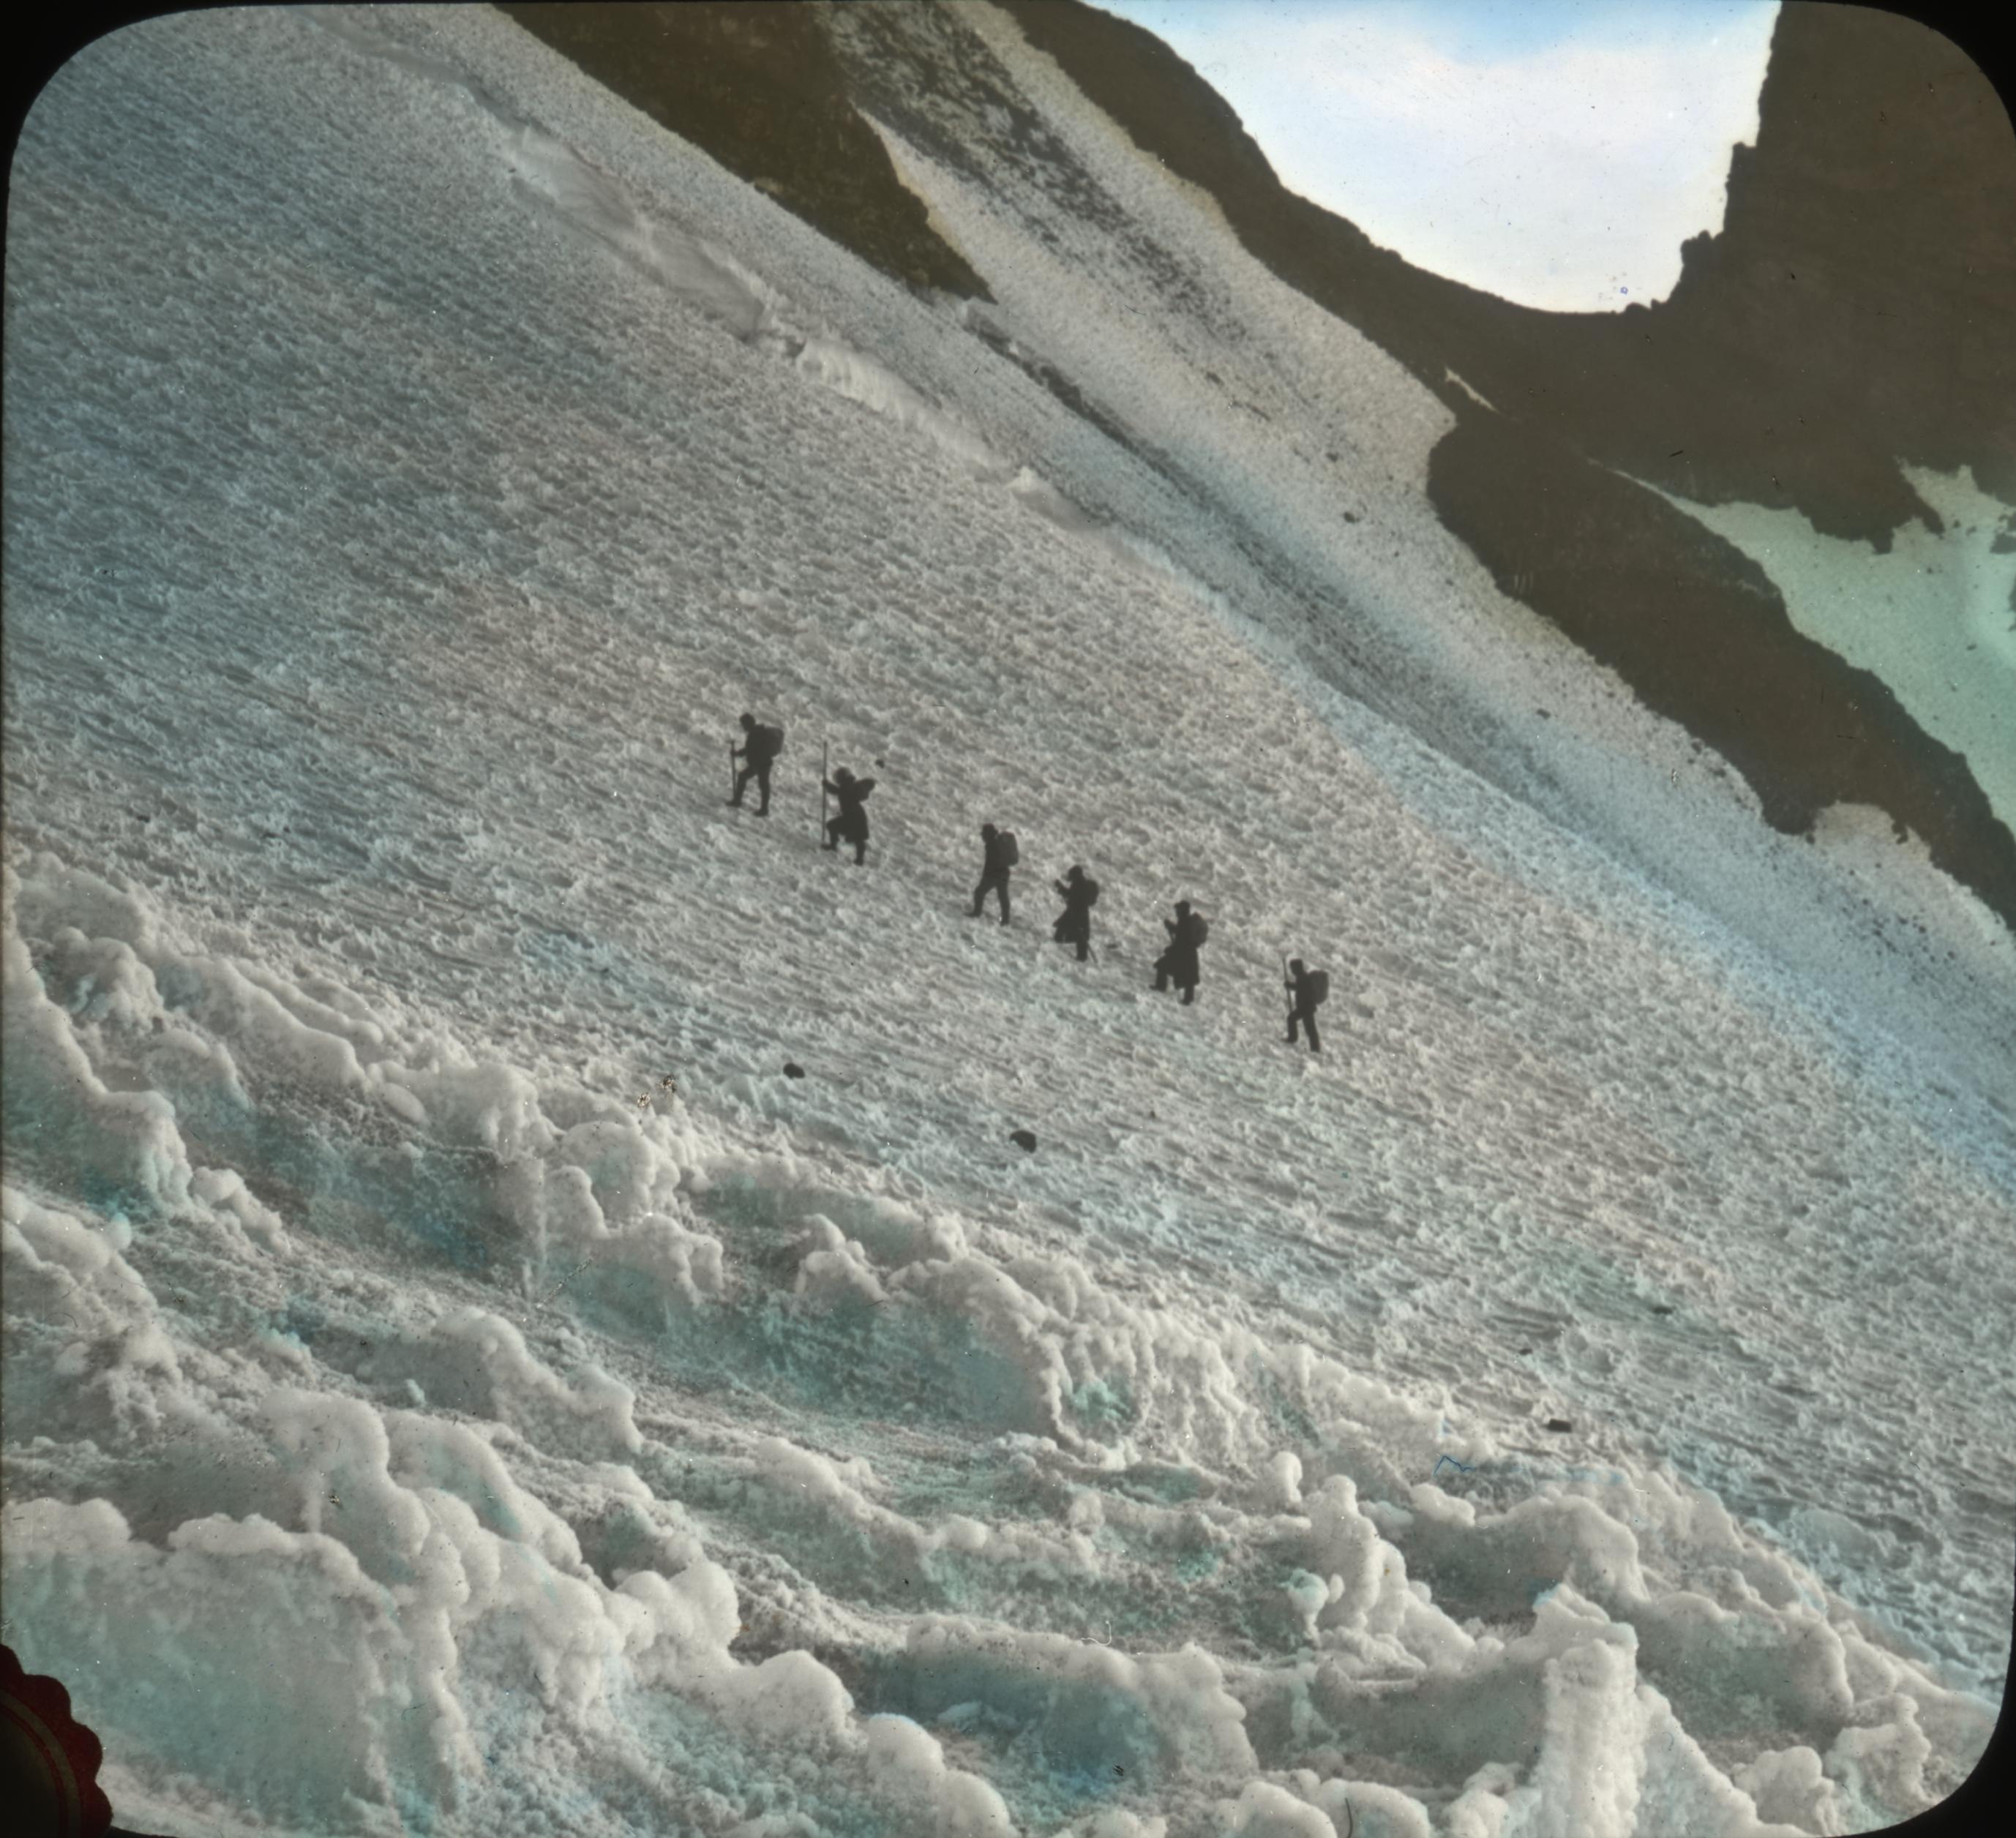
Ice-fields. Lantern slide from Oregon State University Archives. Downloaded from Flickr Commons on 10 March 2011. Image Description from historic lecture booklet: "... where snow accumulates to great depth and lies long upon the surface, it is changed to ice. the beginning of this change may be seen in the snow a few days after it falls, for it soon loses its light, flaky character and becomes granular, so that it feels harsh to the hand. The change is very distinct in the last banks of snow in the spring. They are made up of coarse grains (granules) of ice, sometimes as larges as peas...."


Syracuse in March.  I guess it will make us stronger… if it doesn’t kill us.

Posted in Visual journal | Leave a comment

Fellow travellers

By this point, I would have thought I’d have a pretty good grasp on visual things. I began seriously studying painting and drawing as I entered high school. I have a terminal degree in visual art. My studio art practice spanned decades. Even more, I’ve spent the last five years pursuing social science doctoral research in the area of visual information. I should be an expert, right?

But more often than not, I feel like I’m barely staying oriented in a forest of images and visual experiences. This blog is a record of my travels. It is a trail of bread crumbs.  It is a documentary of images and image-making in the wild. It is a menagerie of inspiring, strange,  beautiful and puzzling specimens from the visual forest.

There are a lot of us out here exploring this visual domain, including artists, designers, social and computer scientists, architects, and historians, to name a few.  We are working in different (and sometimes contentious) disciplines defined by discrete and sometimes singular methodologies: Visual art. Graphic design. Information visualization. Computer visualization. Photography. Video. Digital media. Interaction design. Computer art. Semiotics. Cultural criticism. Art history.

The diversity of those of us traveling in this visual forest speaks to the richness of this place. Images are deeply embedded in our communication systems. Visual representation is thoroughly entwined in our perception of the world. (Those unable to see are not to be excluded, for this lack of coupling can reveal much.) Philosophically, the concept of vision and sight is fundamental.

It is certainly a beautiful and intriguing place, this visual forest. But the paths through this neck of the woods are often non-linear and the signage can be, curiously, simultaneously cryptic and persuasive. So I will try to plot some waypoints as I travel, in an effort to keep sight of the forest amidst all the trees. And now I think I have run the forest metaphor into the ground… (no pun intended.)

Olympic National Park in late August 2009. Photo by Frank Kovalchek. Downloaded from Wikimedia Commons Mar 10, 2011.

Posted in Trail Head | Leave a comment